Custom metrics are exactly that - custom metrics! If you can't find the metric you are looking for in the metrics drop down you can add it to your personal list of custom metrics.
- How To Make a Metric
- Simple Metrics
- Calculated Metrics
- SKU Metrics
- Duplicating, Editing and Deleting
- Video Walkthrough: New and Repeat Customers
How to Make a Metric
To make a metric you can either go to Profile & Settings > Customer Metrics and click the "Create New Metric" button. You can also create a new custom metric directly in a Custom Report by clicking on "Create New Metric" in the drop down metrics menu. Both options will open a pop up window to create the metric
Name - this is the name that will appear on the chart, in dashboards and when you save or email a dashboard.
Internal Name - this is the name given to the metric in the metric drop down menu. It will not appear on the chart. It can be descriptive or include the name of a specific client.
Type - here you can select whether you want the metric to display as a currency amount, percentage, numerical, or numerical to two decimal places. Choosing percentage will automatically multiply the number by 100.
Visibility - like with reports and dashboards you can set the metric to be either public or private.
Metric 1 - select the metric you want to work with. If you are creating a "Simple Metric" you only need to select one metric.
Metric 1 Filter - this is enables you to apply a filter to just the metric you have selected for Metric 1. If you are creating a Simple Metric without a filter the result will not be custom, it will just show the same data as the existing metric.
Function - if you are making a Calculated Metric you'll need to select; plus, minus, multiply by or divide by.
Metric 2 - if you are creating a Calculated Metric you'll need to select the second part of the equation.
Metric 2 Filter - if you are creating a Calculated Metric you can also apply a filter to either of the metrics.
Simple Metrics
Simple metrics are like applying a filter to just a single column, rather than the whole chart or dashboard.
For example, you might want to look at new sales. Without custom metrics, this could be done by applying a filter to Include > Customer Type = New, but this would be applied to all the data in that chart. If you also had columns for clicks, commissions etc, they would all be filtered for just New customers.
But let's say you want to see this broken down by publisher, not for the whole program. Custom metrics enable to you create the metric New Sales which can be included in the chart as a column, so you can view the metric New Sales by publisher in relation to total sales and other metrics.
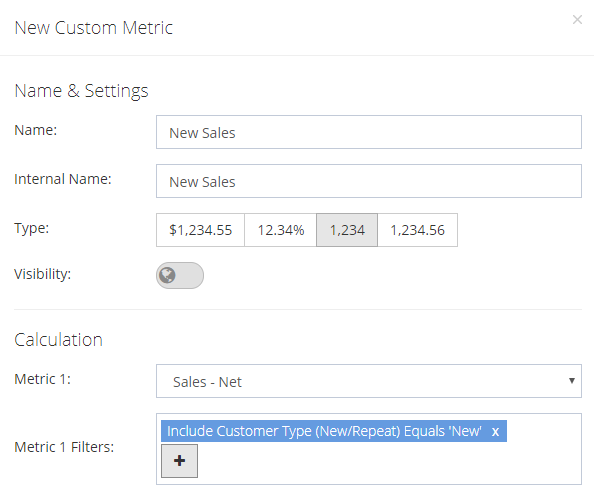
To create a custom metric for new sales, select numerical from the Type, select Sales-Net as Metric 1 and apply Include > Customer Type = New as the filter and click "Create Metric" in the bottom right of the pop up window. You will now be able to the add the metric to your report from your drop down metric selector.
Calculated Metrics
Calculated Metrics have an additional step they involve additional, subtraction, division or multiplication. You can choose to add filters to either, both or neither of the metrics.
For example if you want to show the % of New Sales you need to add a function and second metric. For a the custom metric New Sales as a percentage of Sales-Net, you will also need to select "Divide by" as the function, "Sales-Net" as "Metric 2" and change the "Type" to percentage. 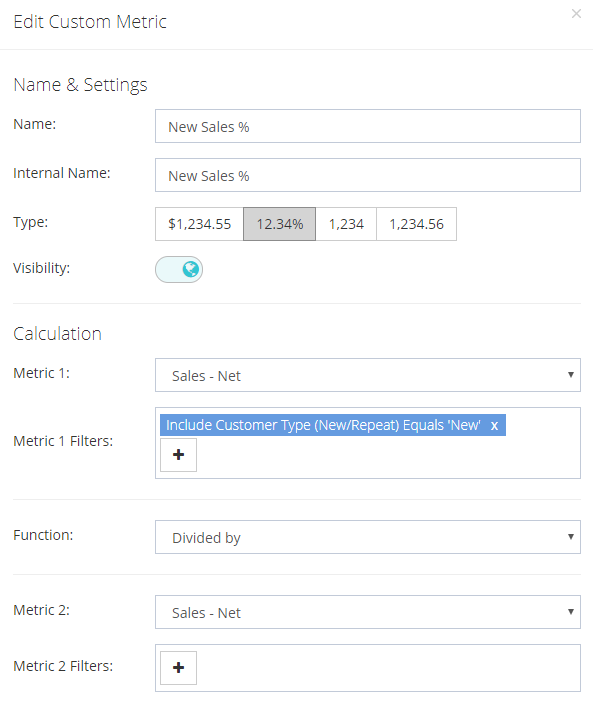
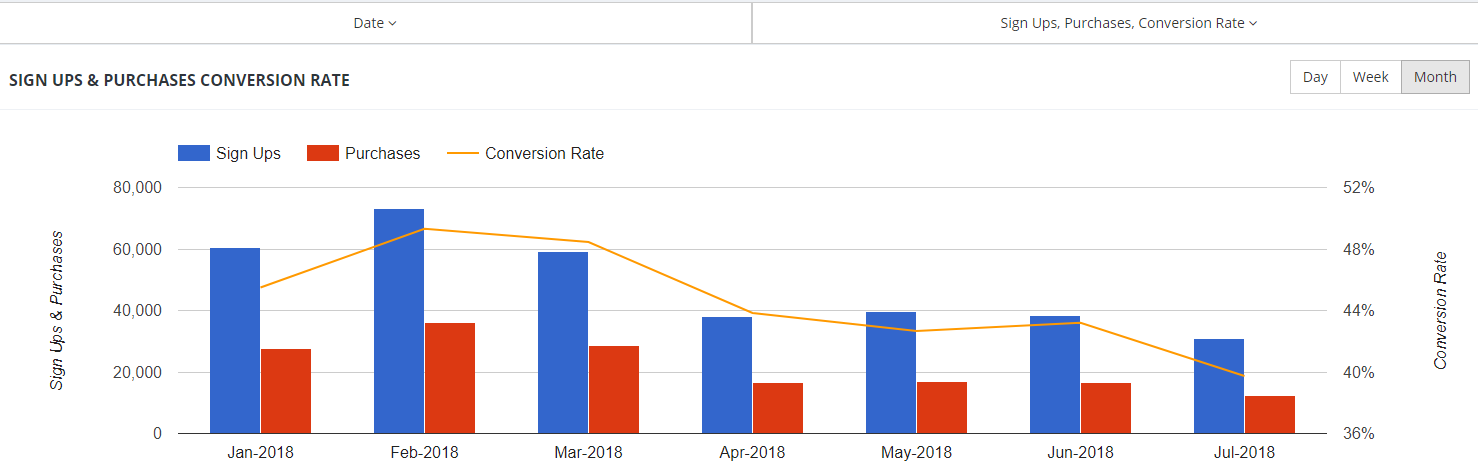
Another example, perhaps you have a client that tracks both "sign-ups" and "purchases". With custom metrics, you can create a chart that shows you the performance of both metrics over time as well as the relationship between them.
- Create the custom metric "Sign Ups" where "Metric 1" is "Actions" and the Metric 1 Filter is set to "Action Tracker" equals "Sign Ups"
- Create the second custom metric "Purchase" where "Metric 1" is "Actions" and the Metric 1 Filter is set to "Purchases"
- Create the third custom metric "Conversion Rate". Select percentage as the "Type". For "Metric 1" select "Actions" and set "Metric 1 Filter" to "Action Tracker" equals "Purchase Detection". Select "Divide by" for the "Function". For "Metric 2" select "Actions" and set "Metric 2 Filter" to "Action Tracker" equals "Sign Ups".
- Add the three new custom metrics and select "Date" as the category (this will show changes over time), and choose "Combo Chart" from the chart selector.
- Be sure to select the appropriate time period from the date selector and you can toggle between day, week and month grouping.
SKU Metrics
Custom Metrics now support SKU-level metrics. This means you can create custom metrics that leverage SKU data such as SKU revenue, SKU quantity, and SKU commissions directly within your custom metric calculations and reporting.
Reminder: SKU Metrics are not compatible with Affiliate Performance metrics and will need to be added to reporting separately from Performance Metrics.
Duplicating, Editing and Deleting
Custom Metrics can be edited, duplicated or deleted in the Custom Metrics tab under Profile & Settings. Click on Profile & Settings (in the main left hand menu), click on "Custom Metrics". Click the trash can icon on the right hand side under "Actions" for the metric you want to delete. deleting a public metric will delete it from all the reports
Video Walkthrough: New and Repeat Customers
Here's a walkthrough for creating custom metrics which show the number of New and Repeat Customers: