Uploading Events
Events are created in Affluent via the Events page which you can access from the left-hand navigation menu. 
When adding an event, the required fields you'll need to enter are the event name, event type, dates of the event, brand, platform and cost.
As you fill out the "Cost" section keep in mind you have the option to split the payment over the event date range or choose an exact date the event was paid.
Splitting the payment over the entire duration of the event will help you determine more accurate performance metrics related to the event, such as RoAS. If choosing an individual date that the event was paid it will attribute the entire event cost to a single day and can impact RoAS, etc.
Note:
When splitting a payment across a date range, the following metrics have the potential to be impacted depending on the date range selected when viewing information about those metrics.
-
Placement Fees
-
Total Publisher Spend
-
Total Spend
-
Total Profit
-
RoAS
-
CPL
-
CPA
-
Cost-to-Revenue
Once an Event has been created, it will appear in the events table. This table can be filtered using the filters at the top of each column.
Creating an Events Table in Reports
Once you've uploaded events via the Events page, you can create an Events Table or Events Timeline in Reports. Open Reports and create a new report.
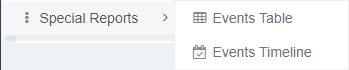
Under report types, select Special Reports > Events Table or Events Timeline
Events Tables
Select Events Table, apply any necessary filters and click 'Run Report'. You do not need to select any categories or metrics.
If you want to display different information in the table, click the cog icon and add or remove fields. You can edit the date range and filters as normal. Events tables are not compatible with comparison mode.Events Timeline
Select Events Timeline and choose the category you want to group events by. If you choose one category, the information displayed on each event bar will default to the name of the event. With only one category selected, all the events in the same row will be the same color.
If you choose a second category e.g. "Publisher", the publisher's name will be displayed on the event bar. Also if that publisher appears in more than one of the rows, their bars will be the same color - grouping all the events by that publisher across categories, in the same color.
You can "Select additional data to display" this will show when you hover over the bar. If no additional fields are selected, just "Dates" and "Duration" will display by default.
You can edit the date range and filters as normal. Events tables are not compatible with comparison mode.
Including Events Reports in Dashboards

In both reports and dashboards, events tables will only display events that occurred within the selected date range. If one or more days of the event falls within the selected date range, it will be displayed. For instance, if your date range is January 1st to January 10th, an event that started on January 9th and ended January 15th will still be displayed due to that overlap. Note, events tables are not compatible with date comparison mode, and do not take in to account dates selected during the comparison period. If an event falls within the the comparison period, it will not be shown in the table. If you would like it to be displayed, you can widen the selected date range. The Events Timeline reports will not be interactive in a PDF. If you would like a client to have access to an interactive Events Timeline the report can be added to a dashboard and the client given restricted access to just that Dashboard. Contact an Admin in your team to discuss client access.