Whether you want to see your performance for a merchant over time, this month's commissions, or which SUB-IDs have the best EPC, then reports are what you're looking for.
Reports can be as detailed or as big picture as you like. Add in categories, metrics, filters, and change the date range as you want.
- Step 1 - Creating a New Blank Report
- Step 2 - Choosing a Report Type
- Step 3 - Adding Data to your Report
- Step 4 - Running a Report
- Step 5 - Saving a Report
Step 1 - Creating a New Blank Report
- To get started, click on "Reports" in the left-hand menu. This is where you create new reports and access existing ones.
- Click the "+ Create New Report" button. This will open a new blank report.

Step 2 - Choosing a Report Type
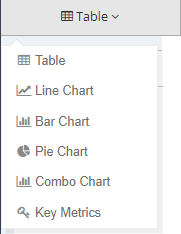
Affluent currently supports the following report types; table, line, bar, pie, combo key metrics. The different report types allow you to select the best way to show your data so that it can be easily understood and interpreted.
To change the report type click the Table drop down on the left hand side and click on the report type you would like to use. Different report types support different amounts and types of data. Tables can contain multiple categories and metrics. Pie charts can only include one metric.
Step 3 - Adding data to your report
Categories & Metrics
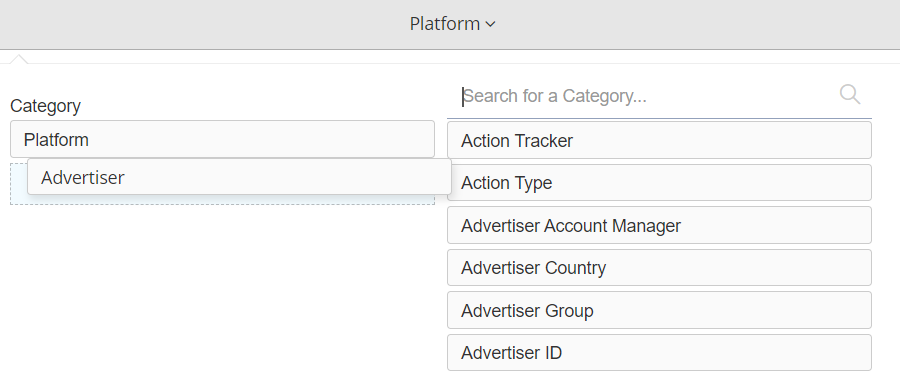
To add data to your report, you will need to select 'Categories' and 'Metrics'. Categories generally refer to what or which e.g. merchant, platform, or SUB - ID. Metrics generally refer to how much or how many e.g. commission, clicks, or number of sales.
Note: To add a category or a metric into your report, you must drag and drop your chosen category and/or metric directly into the dotted blue box at the left column.
Filters
Filters allow you to include or exclude data from categories. You may want to exclude a certain merchant from a graph, to only include one platform, to select a number of SUB-IDs.
Date range
The date selector in the top right-hand corner allows you to alter the data shown in the report by date. You can choose from Preset Ranges such as yesterday, last month, or year to date these will automatically update. Or, you can select a custom date using the calendar.
Select "Compare to" to show data from two different time periods in one report. You can compare to the previous period, the previous year, or select a custom range. "Compare" is useful for showing week over week data or using a custom range to compare similar periods of time e.g. Black Friday this year vs last year.
Step 4 - Running a Report
Once you have selected the categories, metrics, and filters for your report click 'Run Report' in the top left hand. After making any changes to a category, metric, or filter always click 'Run Report' to update the data.
Step 5 - Saving a Report
Naming a Report
Click 'Untitled' on the top right, to name the document. Names can be edited at any point by clicking on the title.
Saving a Report
To save the report, click 'Save' next to 'Run Report'. Remember to save the report regularly before you leave the page. 'Save As' allows you to make an additional copy of a report, for example, if you've made changes but don't want to lose the original report.