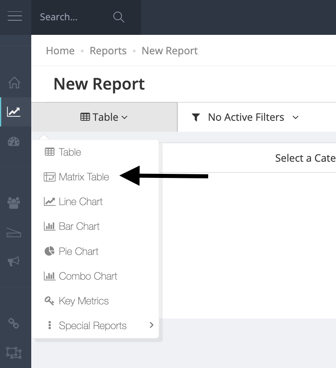
To build a matrix report select "Matrix Table" from the drop-down menu under the title of the report:
You must select two categories in order to set up your matrix table.
Example: Date and Publisher:
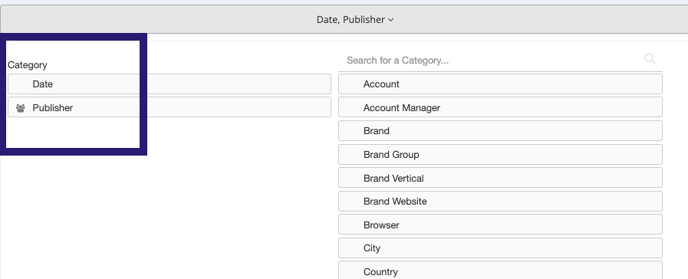
Whichever category you list first will display as the Y axis and the second category will display as the X axis. (In the example above the "Date" category will show as the Y axis).
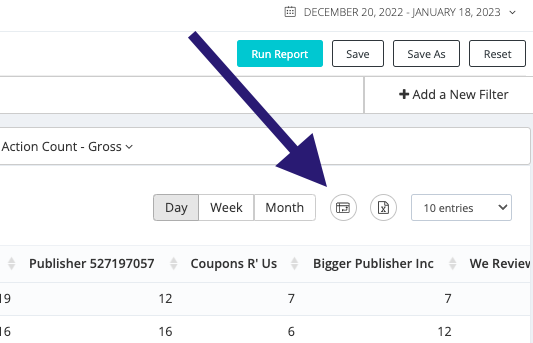
Choose one metric to complete your matrix table and click the "Run Report" button in the upper right-hand corner of your screen in order to see your matrix table.
If you'd like to swap out the X and Y axes you can click the icon in the upper right-hand corner of the report:
In this example, you would now see the date as the X-axis and it's also denoted directly above the table: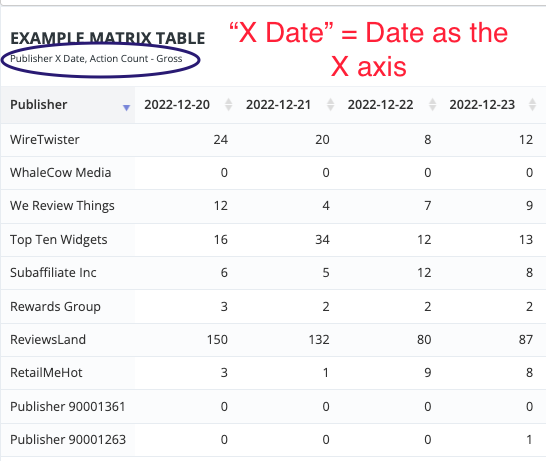
Matrix table not what you're looking for? Check out the other options: